渋滞予測情報の提供による渋滞緩和効果
平成18年9月8日
東日本高速道路株式会社
渋滞予測情報の提供による渋滞緩和効果
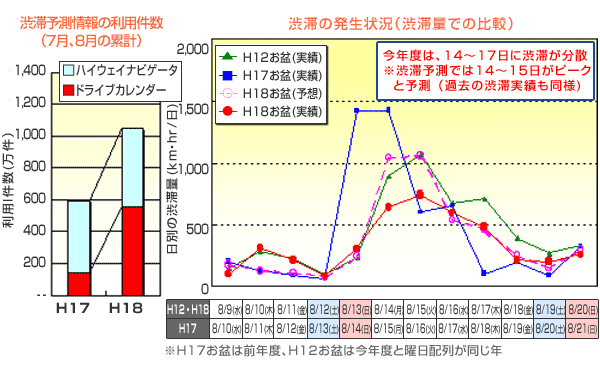
- 当社エリア内の高速道路の日交通量は昨年より若干増加しましたが、上り線では渋滞が8月14日(月)から17日(木)にかけて分散したため、渋滞の発生回数、渋滞量※1が昨年より約2割減少しました。
- 上り線の渋滞が減少した要因として、長期の夏季休暇を取る企業が多かった※2ことに加え、渋滞予測情報をご覧になり、渋滞のピークの14日(月)~15日(火)を避けて、渋滞予測の少ない日に高速道路を利用されたお客様が多かったことも要因として考えられます。
- 渋滞予測情報は多くのお客様にご利用いただいており、今年度の7月、8月には前年度の約1.8倍のご利用件数がありました。
(7月、8月の全国の渋滞予測情報(ホームページ、携帯)のご利用件数 1,000万件)
また、高速道路情報サイト『ドラなび』で行った渋滞予測情報に関するアンケートでは、約4割の方が「渋滞予測情報により渋滞を回避する」と回答されました。
- 『渋滞量』は渋滞の大きさを表す指標(渋滞長×渋滞時間)
- 平成18年6月16日厚生労働省発表の「平成18年夏季における連続休暇の実施予定状況調査結果」では平均連続休暇日数が7.9日
【上り線の渋滞状況】 5km以上の渋滞を対象
上り線における5km以上の渋滞発生回数、渋滞量は、前年度より約22%減少しました。
- 渋滞発生回数:H17年 150回 ⇒ H18年 115回(▲23%)
- 総渋滞量:H17年 5.3千km・hr ⇒ H18年 4.2千km・hr(▲22%)
- ドライブカレンダー
- :今後6ヶ月間の渋滞予測情報を提供(ピーク時の通過所要時間、時間毎の渋滞長など)
- ハイウェイナビケータ
- :出発時間毎に渋滞予測を考慮した到着時間、通過所要時間を提供

PDFファイルをご覧いただくには、AdobeSystems社のプラグインソフト「Acrobat Reader(日本語版)」が必要です。お持ちでない方は、こちらからダウンロード(無料)してご利用ください。
関連サイト・コンテンツ
料金・ルート検索、サービスエリア・パーキングエリアの情報をお探しの方はこちら。
リアルタイムの渋滞・規制情報をお探しの方はこちら。
災害時の通行止めなどの道路情報をお探しの方はこちら。