
Expressway traffic conditions during the Golden Week period (flash report) [East Japan version]
12 days from Saturday, April 25, 2015 to Wednesday, May 6, 2015
- Corporate Top
- Press Room
- Press Release Headquarters
- Expressway traffic conditions during the Golden Week period (flash report) [East Japan version]
May 7, 2015
East Nippon Expressway Co., Ltd.
NEXCO EAST (Chiyoda-ku, Tokyo) has summarized traffic conditions during the Golden Week period.
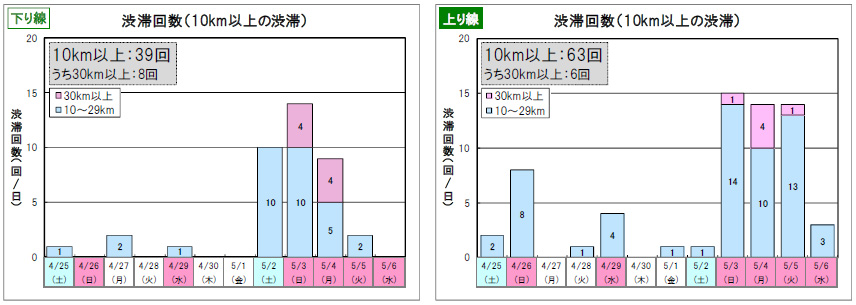
- The number of times of traffic congestion of 10 km or more, 102 times same as last year was.
- The number of times of congestion over 30 km, 14 times, 2 times less than last year Did.
- The maximum congestion length is 63.9km that occurred around 10:00 on Sunday, May 3rd around Tohoku Expressway (Out-bound line) Iwafune JCT was.
- The year-on-year change in the average daily traffic volume of the 23 main sections is About 2% increase Did.
1 congestion
[Number of traffic jams]
[Last year: H26.4.25 (Fri)-5.6 (Tue): 12 days]
| Traffic jam scale | (1) 2015 results | (2) 2014 results | (3) Difference ((1)-(2)) | ||||||
|---|---|---|---|---|---|---|---|---|---|
| total | going down | going up | total | going down | going up | total | going down | going up | |
| Number of traffic jams over 10 km | 102 | 39 | 63 | 102 | 39 | 63 | ±0 | ±0 | ±0 |
| Of which, the number of traffic congestions of 30 km or more | 14 | 8 | 6 | 16 | 9 | 7 | ▲2 | ▲1 | ▲1 |
2-day average traffic volume
[Main 23 sections * Average daily traffic during the period in
[Last year: H26.4.25 (Fri)-5.6 (Tue): 12 days]
| (1) 2015 results | (2) 2014 results | YoY (1) / (2) | |
|---|---|---|---|
| Average daily traffic volume | 38,900 units/day | 38,100 units/day | 102% |
- Detailed daily average traffic volume Attachment 1 [PDF: 117KB] Please refer to the.
[Reference] Past day arrangement
![[Reference] Image of past day arrangement](/rest/pressroom/press_release/head_office/h27/0507b/images/02.jpg)
3 Main traffic congestion points
[Major traffic jam locations during the 2015 Golden Week period]
| Vertical line | Road name | Traffic jam date and time (peak) | Traffic jam location | Congestion length | Congestion factors | |
|---|---|---|---|---|---|---|
| 1 | Out-bound line | Tohoku Expressway | May 3 (Sun) around 10:00 | Near Iwafune JCT | 63.9km | Traffic concentration and accident |
| 2 | Out-bound line | Kan-Etsu Expressway | Sunday, May 3, around 9:45 | Near the Hanazono IC | 48.8km | Accident and traffic concentration |
| 3 | Out-bound line | Joban Expressway | Sunday, May 3, around 10:20 | Near Tomobe JCT | 46.6km | Traffic concentration and accident |
| 1 | In-bound line | Kan-Etsu Expressway | Monday, May 4th, around 19:10 | Near Tsurugashima IC | 49.0 km | Traffic concentration and accident |
| 2 | In-bound line | Tohoku Expressway | Monday, May 4, around 17:50 | Near Hanyu PA | 41.0 km | Traffic concentration and accident |
| 3 | In-bound line | Tohoku Expressway | Monday, May 4th, around 16:30 | Near Kamikawachi SA | 34.2km | Accident and traffic concentration |
[Reference] Major traffic congestion points during the Golden Week period of last year (H26)
| Vertical line | Road name | Traffic jam date and time (peak) | Traffic jam location | Congestion length | Congestion factors | |
|---|---|---|---|---|---|---|
| 1 | Out-bound line | Tohoku Expressway | Saturday, May 3, around 9:35 | Near Iwafune JCT | 63.9km | Traffic concentration and accident |
| 2 | Out-bound line | Kan-Etsu Expressway | Saturday, May 3 at 8:50 | Near the Hanazono IC | 52.6km | Traffic concentration and accident |
| 3 | Out-bound line | Kan-Etsu Expressway | Sunday, May 4, around 8:55 | Near the Hanazono IC | 49.0 km | Traffic concentration and accident |
| 1 | In-bound line | Kan-Etsu Expressway | May 5 (Monday) around 15:50 | Near Takasaka SA | 44.0 km | Traffic concentration |
| 2 | In-bound line | Tohoku Expressway | May 5 (Monday) around 16:55 | Near Kamikawachi SA | 42.8km | Traffic concentration and accident |
| 3 | In-bound line | Tohoku Expressway | May 5 (Monday) around 17:00 | Near Hanyu PA | 34.8km | Traffic concentration and accident |
- JCT: Junction, IC: Interchange, SA: Service area, PA: Parking area
[Reference] Number of traffic jams nationwide (NEXCO EAST /Central/West Japan, Honshi Expressway)
[Last year: H26.4.25 (Fri)-5.6 (Tue): 12 days]
| Traffic jam scale | (1) 2015 results | (2) 2014 results | (3) Difference ((1)-(2)) | ||||||
|---|---|---|---|---|---|---|---|---|---|
| total | going down | going up | total | going down | going up | total | going down | going up | |
| Number of traffic jams over 10 km | 328 | 137 | 191 | 284 | 118 | 166 | +44 | +19 | +25 |
| Of which, the number of traffic congestions of 30 km or more | 30 | 17 | 13 | 33 | 18 | 15 | ▲3 | ▲1 | ▲2 |
Reference material

To view the PDF file, you need the Adobe Systems plug-in software "Acrobat Reader (Japanese version)". If you do not have Download from here (free)Please use it.
Related Sites and Content
If you are looking for information on fares, routes, service areas and parking areas, please click here.
If you are looking for real-time traffic congestion and restriction information, click here.
NEXCO EAST (Road Disaster Prevention Information) Official X
Click here if you are looking for road information such as road closures during disasters.