Measures for congestion on Expressway
- Corporate Top
- Business guide
- Road management and operation business
- Measures for congestion on Expressway
We analyze the causes of traffic congestion and implement measures to alleviate and alleviate traffic congestion.
Changes in traffic congestion
Congestion loss time on Expressway * 1 Has been on a downward trend since peaking in 1997, and has decreased to about 50% of its peak in 2008.
After that, there was an increase due to special holiday discounts from 2009 onwards (50% off in rural areas, maximum 1,000 yen, etc.), but since 2014, there has been a continuing downward trend due to the effectiveness of various congestion countermeasures. However, since 2017, traffic volume in our jurisdiction has increased due to the development of networks in the Tokyo metropolitan area, and the time lost due to congestion has increased again.
In 2020, the number of visitors decreased significantly due to the impact of the COVID-19 pandemic, but it is gradually increasing as the pandemic subsides.
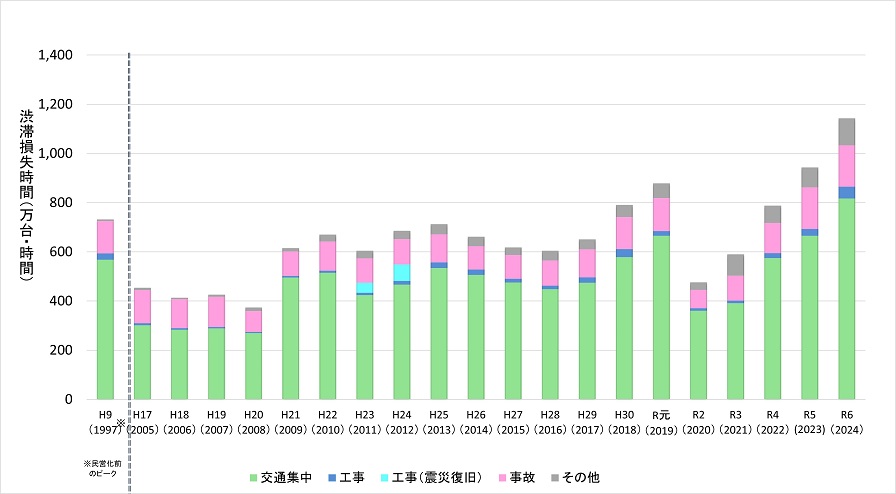
- An index showing the degree of traffic congestion. It is calculated by multiplying the loss time due to traffic congestion and the number of affected vehicles.
- 1997 was the peak before privatization (NEXCO EAST jurisdiction)
- "Others" includes traffic jams due to the effects of broken down vehicles and falling objects, and traffic jams due to accidents in the oncoming lane.
- Due to the traffic regulations associated with the Tokyo 2020 Games in 2021, the percentage of "others" is higher than usual.
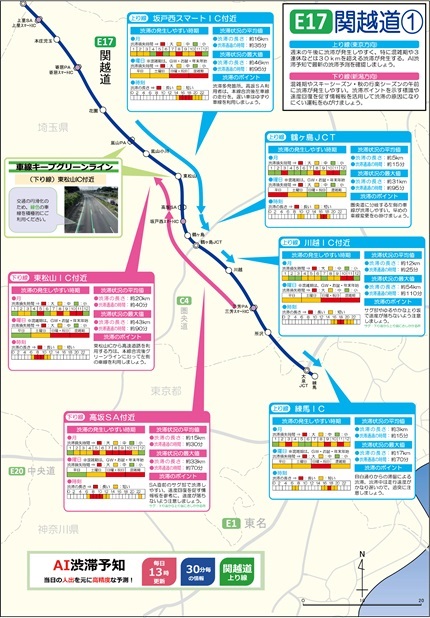
Causes and Locations of Traffic Congestion
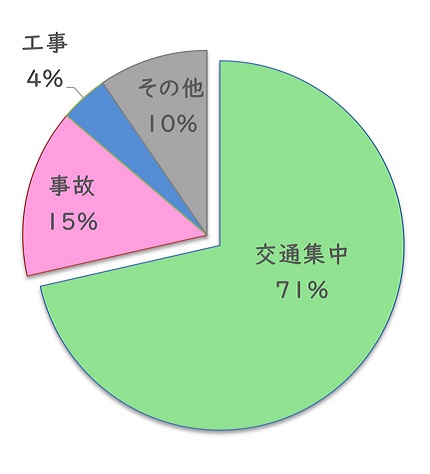
一年間に管内で発生する渋滞のうち約7割が交通集中によるものです。(2024年)
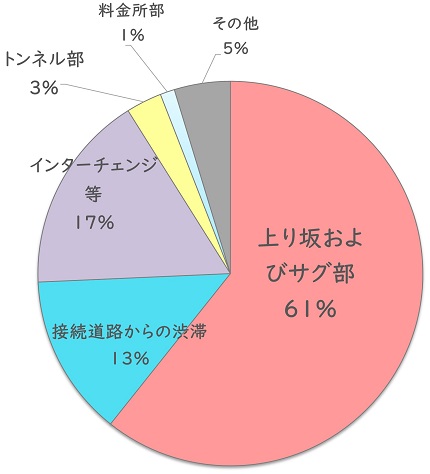
Of these, In-bound and sag * 5 account for about 60% of the breakdown of traffic congestion.
* 5 The concave part that goes from the Out-bound to the In-bound is called the sag part. Click here for details on the mechanism of traffic congestion and measures against traffic congestion
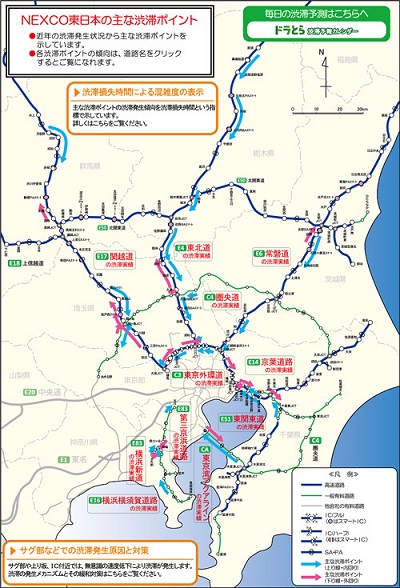
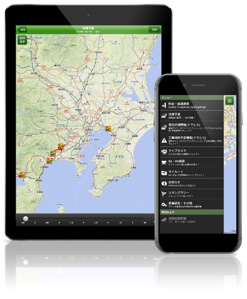
[Congestion point map]
The main traffic congestion points and traffic congestion trends in NEXCO EAST are posted on the "Congestion Point Map". Please help us avoid traffic jams.
[Development and dissemination of ETC]
The congestion at the toll booth, which was the worst concentrated traffic congestion, has almost disappeared due to the spread of ETC.
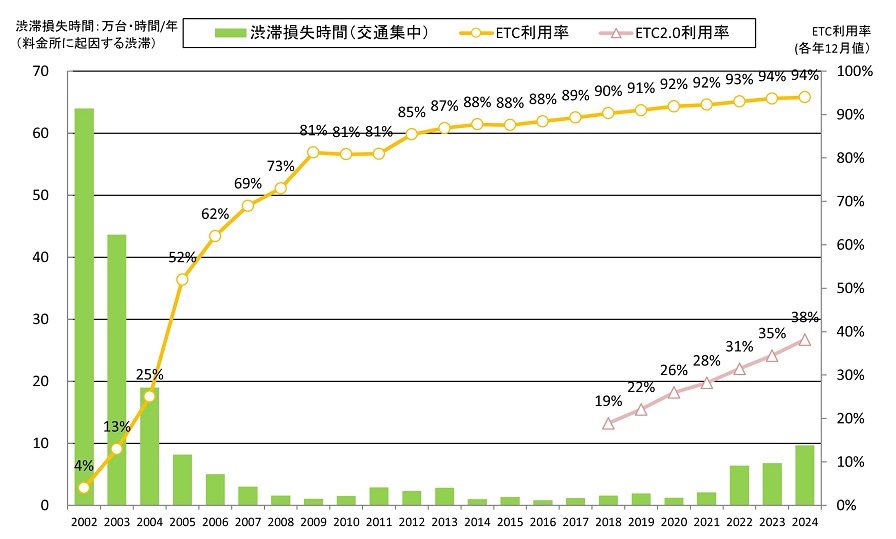
*6 Figures for NEXCO EAST jurisdiction even before privatization
*7 ETC2.0 usage rate is included in ETC usage rate.
Traffic congestion mitigation measures
In order to secure safe and smooth road traffic for our customers, we will implement both hardware and software measures to reduce traffic congestion.
-
Hardware measures
-
Soft measures
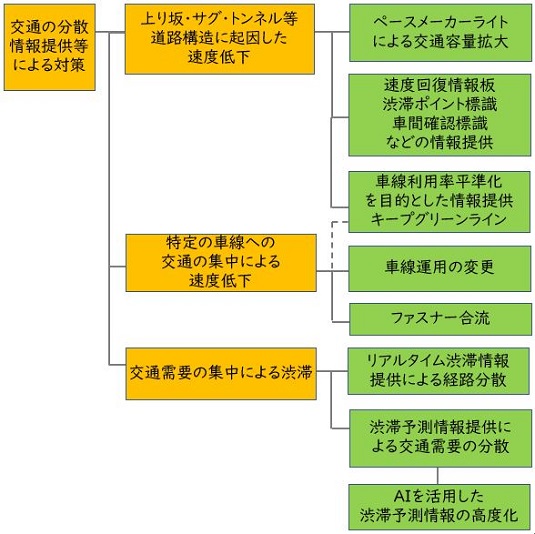
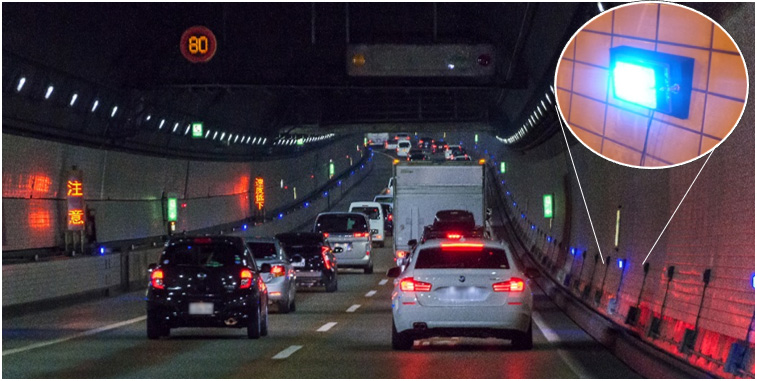
- Large of traffic capacity with pacemaker light (PML)
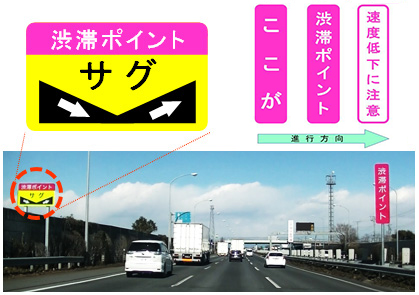
- Providing speed recovery information by traffic jam point signs, etc.
- Congestion countermeasures by promoting the use of driving lanes
- Change of lane operation
- Trial of measures to promote fastener merging
- Providing traffic jam forecast information
- Providing information using AI
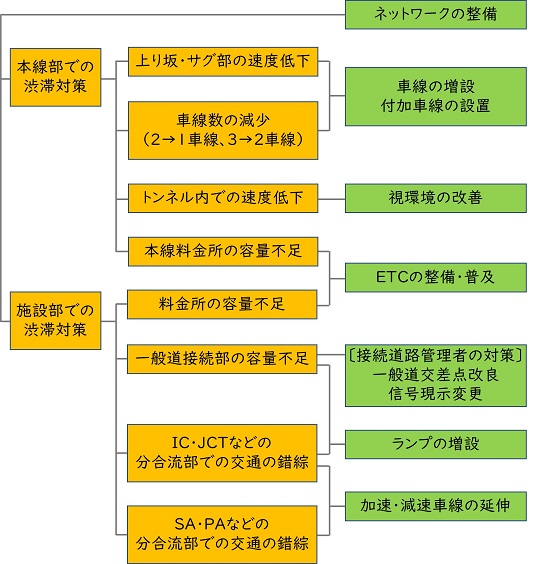
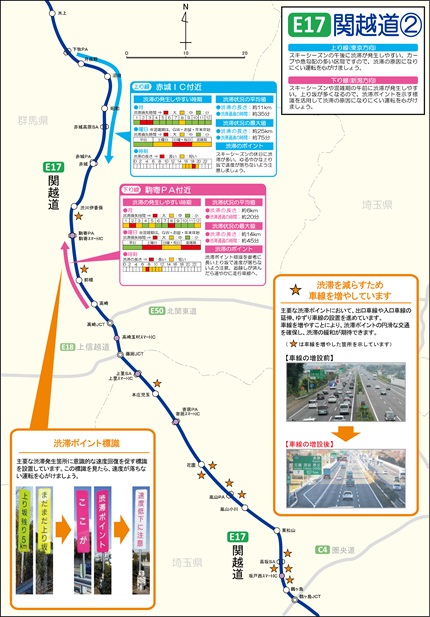
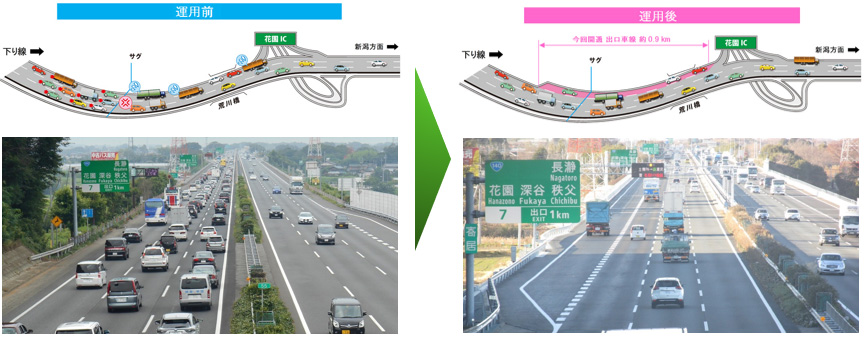
[Installation of additional lanes] [Extension of acceleration / deceleration lanes]
We are installing additional lanes and extending acceleration / deceleration lanes at major traffic congestion areas.
-
E17 Kan-Etsu Expressway (Out-bound) Hanazono IC exit lane extension status
[Large of traffic capacity with pacemaker light (PML)]
By blinking the light so that it moves in the direction of travel, it is effective in suppressing speed reduction and supporting speed recovery.
-
PML operation status near the aqua line (In-bound) aqua tunnel
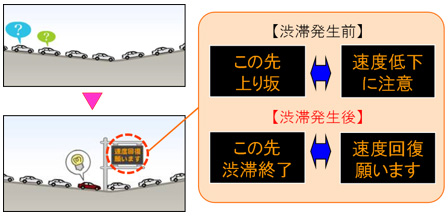
[Providing speed recovery information through traffic congestion point signs, etc.]
Signs are installed at major traffic congestion points to promote conscious speed recovery.
- Operation status of traffic jam point signs
- Operation status of speed recovery display board
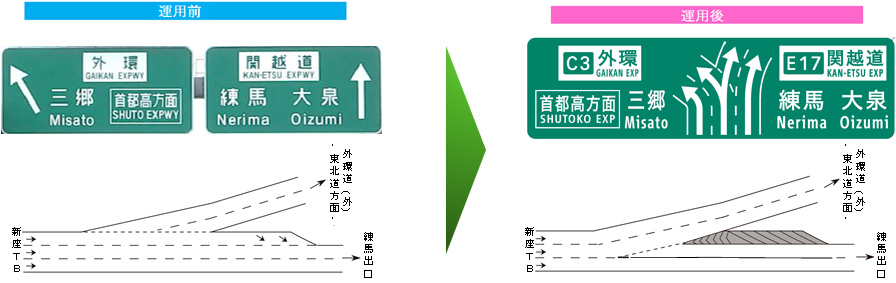
[Change of lane operation]
We are improving the lane operation so that it can respond to changes in traffic conditions.
-
E17 Kan-etsu Kan-Etsu Expressway (In-bound) Oizumi JCT lane operation change status
-
E17 Kan-Etsu Expressway (Out-bound) Lane keep green line near Higashimatsuyama IC
By continuing to keep left along the lane keep green line, it is possible to reduce the concentration of vehicles in the overtaking lane and unreasonable lane changes, thereby reducing congestion and accidents.
Also, if you run along the green line from the ramp, you can naturally join the main line in the correct direction, so you can expect the effect of reverse driving countermeasures.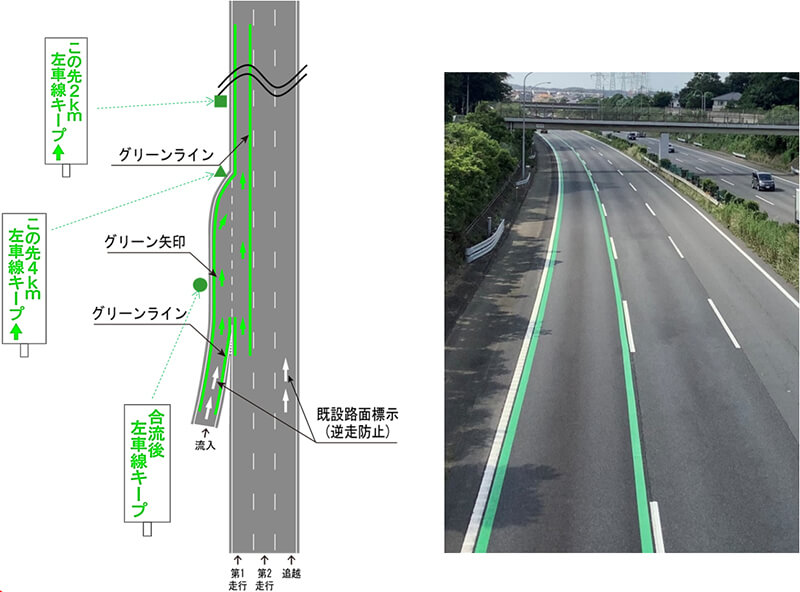
[Providing traffic congestion prediction information]
NEXCO東日本には、地域の特性を熟知した渋滞予測のプロである「渋滞予報士」がいます。
いつ、どこで、どのくらいの渋滞が発生するかを予測し、HPなどで提供しています。
渋滞緩和のため混雑する日にちや時間帯を避けた「分散利用」へのご協力をお願いいたします。
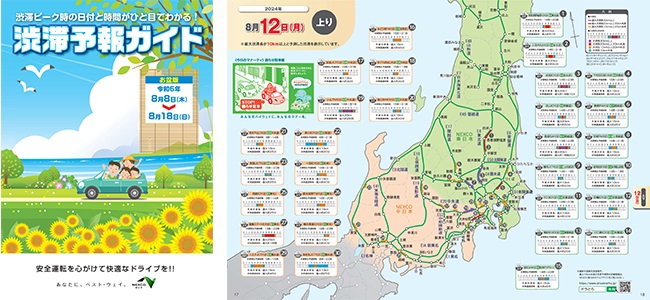
Click here for a traffic forecast guide during the busy season
また、当社では、橋やトンネルなどの大規模なリニューアル工事を実施しています。こうした工事では、長期通行規制による影響を最小限にすべく工事短縮や通行規制方法の工夫に取り組んでいますが、重交通路線などではやむを得ず渋滞が発生する場合があります。
こうした渋滞を少しでも減らせるように、リニューアル工事等の長期規制を伴う工事による渋滞についても、単なる「予想」ではなく交通工学に基づく正確な「予測」を実施し、お客さまへ丁寧な情報発信を心掛けています。
健全な道路を次世代につなげるために、ご理解とご協力をお願いいたします。
[Information provision using AI]
We are promoting technological development such as traffic jam prediction using AI, and are working to further improve prediction accuracy and convenience.
-
AI traffic jam prediction
株式会社NTTドコモ(以下、ドコモ)が携帯電話ネットワークの仕組みを利用して作成するリアルタイム人口統計と、NEXCO東日本が保有する過去の渋滞実績や交通流に関する技術的知見等をかけ合わせ、ドコモが人工知能(AI)技術を用いて開発した「AI渋滞予知」により、一部路線において帰宅時間帯の渋滞を予測する実証実験を行っています。実験では、30分ごとの通過所要時間などの情報をNEXCO東日本のお客さま向けWEBサイト「ドラぷら」で配信しています。
また、「AIルートジャッジ」では、木更津から特定のエリアに向かう際、アクアライン経由のルートと京葉道路経由のルートでどちらが早い予測となるかを掲載しています。
東京方面や埼玉方面に帰る際の移動計画にお枠立てください。- AI traffic jam prediction
- [CA] Prediction of AI congestion on the Tokyo Wan Aqua-Line Expressway In-bound line
- [E17] AI congestion prediction on the Kan-Etsu Expressway In-bound
- [E14] AI traffic congestion prediction on Keiyo Road and In-bound Expressway (demonstration experiment)
- AIルートジャッジ~アクアvs京葉・館山~
Related Press Release
- NEXCO EAST and NTT Docomo, [CA] Tokyo Wan Aqua-Line Expressway starts traffic jam prediction demonstration experiment by "AI traffic jam prediction"
- [CA] Tokyo Wan Aqua-Line Expressway 's "AI Congestion Prediction" will provide transit time every 30 minutes
- Predict traffic congestion on the Kan-Etsu Expressway with "AI Congestion Prediction" [E17]!
- "AI Congestion Prediction" From July 28, 2022 [E14] Started demonstration experiment on Keiyo Road
-
[E14] "AI Traffic Jam Prediction" currently being tested on Keiyo Road to be renewed on December 13, 2023
(Traffic congestion forecast for Expressway during the New Year period [East Japan Edition] Appendix 4) -
新サービス「AIルートジャッジ~アクアvs京葉・館山~」11月19日より実証実験開始
~AI渋滞予知の技術を応用した新サービス!木更津からのルート選択にご活用ください~
![[CA] Image image of AI traffic jam prediction on Tokyo Wan Aqua-Line Expressway In-bound line](/assets/img/activity/safety/safety07-13.jpg)
In order to reduce traffic congestion, not only our efforts but also the cooperation of customers who use the Expressway are indispensable.
By having as many customers as possible know about traffic congestion and practice "a little effort" to reduce traffic congestion, the effectiveness of our measures against traffic congestion will be multiplied.
NEXCO EAST will continue to promote traffic congestion measures with this logo as a catch phrase so that we can enhance the "multiplication of traffic congestion measures" with such customers.
Thank you for your understanding and cooperation.
4 items of "traffic jam prevention driving" that we want our customers to practice to alleviate traffic jams
- Be careful of unconscious slowdowns! *8
Even a slight slowdown in speed on In-bound or in a sag can cause traffic jams. - Secure the distance between cars!
It acts as a cushion and prevents the brakes from being transmitted to the following vehicle. - Refrain from changing lanes unnecessarily!
Unnecessarily changing lanes can cause the following vehicle to brake and cause or worsen traffic congestion. - Rapid speed recovery! (During traffic)
Road information boards and traffic jam point signs inform you of the top position of traffic jams.
Please recover the speed promptly after passing the traffic jam.
*8 This does not deny the use of brakes to avoid danger or ensure safety.