Traffic situation on highway in Bon Festival (preliminary report) 【NEXCO EAST Edition】
August 5 (Sat) - August 16 (Wed) 12 days from 2017
- Corporate Top
- Press Room
- Press Release Headquarters
- Traffic situation on highway in Bon Festival (preliminary report) 【NEXCO EAST Edition】
August 17, 2017
East Nippon Expressway Co., Ltd.
NEXCO EAST (Chiyoda-ku, Tokyo) compiled the traffic situation during the Bon Festival.
- The number of times of traffic congestion of 10 km or more, Almost the same as last year was.
- The number of times of congestion over 30 km, Approximately 17% (4 times) less than last year Did.
- The maximum length of traffic is, August 6 (Sun) Around 17:15,E17 Kan-Etsu Expressway (In-bound line) 50.2km that occurred near the Tsurugashima IC was.
- 主な30区間の日平均交通量は前年とほぼ同様でした。
- C4圏央道(桶川加納~白岡菖蒲、阿見東~稲敷)は今年2月の境古河~つくば中央の開通に伴い、昨年比で約25%と大幅に増加しました。
- 昨年比でE4東北道(那須~白河)は約3%減少、E6常磐道(高萩~北茨城)は約3%増加しました。
1. Crowding situation
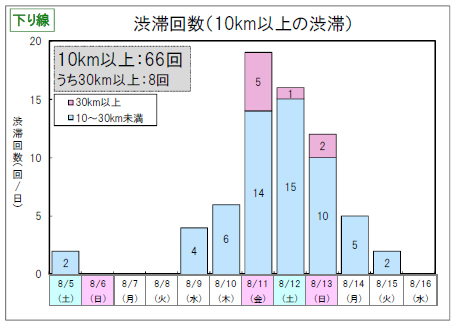
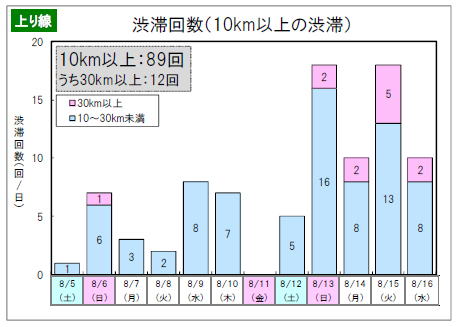
[Number of traffic jams]
[平成28年度:H28.8.6(土)~H28.8.17(水)]
| Traffic jam scale | (1)FY2017 results | (2) FY2016 results | (3) Difference ((1)-(2)) | ||||||
|---|---|---|---|---|---|---|---|---|---|
| total | going down | going up | total | going down | going up | total | going down | going up | |
| Number of traffic jams over 10 km | 155 | 66 | 89 | 156 | 66 | 90 | ▲1 | ±0 | ▲1 |
| Of which, the number of traffic congestions of 30 km or more | 20 | 8 | 12 | 24 | 8 | 16 | ▲4 | ±0 | ▲4 |
2. Average daily traffic volume
[Main 30 sections * Average daily traffic during the period in
[平成28年度:H28.8.6(土)~H28.8.17(水)]
| (1)FY2017 results | (2) FY2016 results | YoY (1) / (2) | |
|---|---|---|---|
| Average daily traffic volume | 40,500 units / day | 40,700 units/day | 100% |
- Detailed daily average traffic volume Attachment 1 [PDF: 143KB] Please refer to the.
3. Main traffic jam points
【平成29年度 お盆期間の主な渋滞発生箇所】
| Vertical line | Road name | Traffic jam (peak) |
Traffic jam location | Congestion length | Congestion factors | |
|---|---|---|---|---|---|---|
| (1) | Out-bound line | E17 Kan-Etsu Expressway |
8月11日(金) 7:20頃 |
Near the Hanazono IC | 48.4 km | Traffic concentration and accident |
| (2) | Out-bound line | E4 Tohoku Expressway |
8月11日(金) 10:15頃 |
Near Yaitakita PA | 47.4km | Traffic concentration and accident |
| (3) | Out-bound line | E4 Tohoku Expressway |
8月13日(日) 9:15頃 |
Near Hanyu PA | 39.7km | Traffic concentration and accident |
| (1) | In-bound line | E17 Kan-Etsu Expressway |
8月6日(日) 17:15頃 |
Near Tsurugashima IC | 50.2 km | Traffic concentration and accident |
| (2) | In-bound line | E17 Kan-Etsu Expressway |
8月15日(火) 15:10頃 |
Near Tsurugashima IC | 49.0 km | Traffic concentration and accident |
| (3) | In-bound line | E4 Tohoku Expressway |
8月15日(火) 16:40頃 |
Near Kamikawachi SA | 46.8km | Traffic concentration and accident |
【参考】昨年度(平成28年度)のお盆期間の主な渋滞発生箇所
| Vertical line | Road name | Traffic jam (peak) |
Traffic jam location | Congestion length | Congestion factors | |
|---|---|---|---|---|---|---|
| (1) | Out-bound line | E4 Tohoku Expressway |
8月11日(木)11:05頃 | Near Yaitakita PA | 50.4km | Traffic concentration and accident |
| (2) | Out-bound line | E17 Kan-Etsu Expressway |
8月13日(土)09:20頃 | Near the Hanazono IC | 44.8km | Traffic concentration and accident |
| (3) | Out-bound line | E17 Kan-Etsu Expressway |
8月12日(金)11:25頃 | Near the Hanazono IC | 42.6 km | Traffic concentration |
| (1) | In-bound line | E4 Tohoku Expressway |
8月16日(火)17:35頃 | Near Kamikawachi SA | 52.4 km | Traffic concentration |
| (2) | In-bound line | E4 Tohoku Expressway |
8月14日(日)16:30頃 | Near Kuki IC | 51.7km | Traffic concentration and accident |
| (3) | In-bound line | E4 Tohoku Expressway |
8月15日(月)19:15頃 | Near Kamikawachi SA | 46.7km | Traffic concentration and accident |
- IC: Interchange, SA: Service area, PA: Parking area
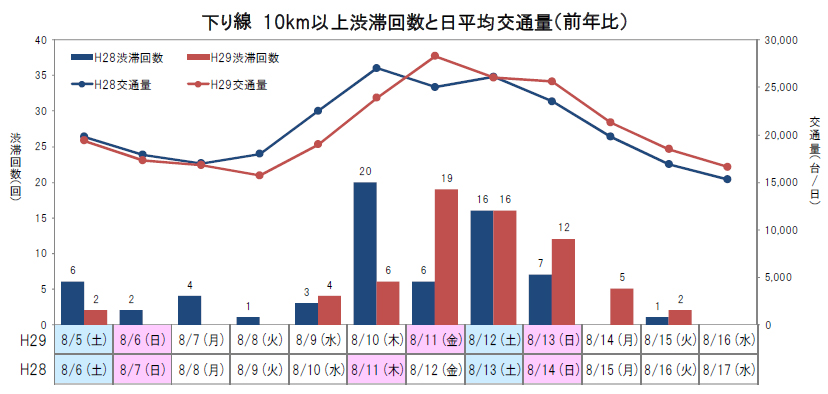
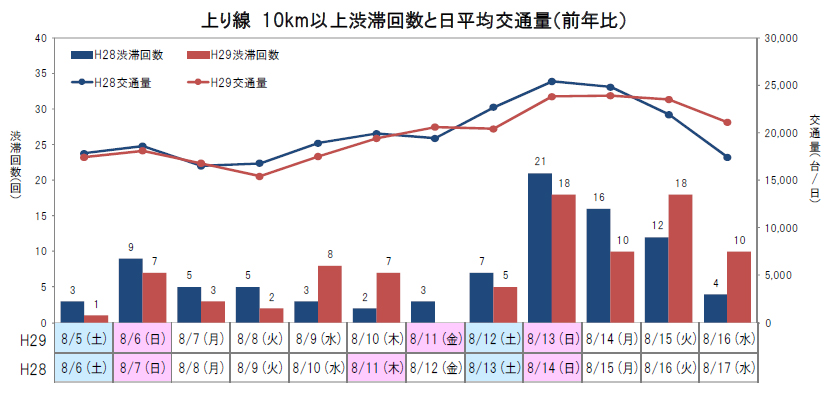
4. Traffic trends (comparison with previous year)
- Congestion peaks were August 11 for Out-bound lines and August 13 and 15 for In-bound lines.
- The number of traffic jams was almost the same as the previous year.

To view the PDF file, you need the Adobe Systems plug-in software "Acrobat Reader (Japanese version)". If you do not have Download from here (free)Please use it.
Related Sites and Content
If you are looking for information on fares, routes, service areas and parking areas, please click here.
If you are looking for real-time traffic congestion and restriction information, click here.
NEXCO EAST (Road Disaster Prevention Information) Official X
Click here if you are looking for road information such as road closures during disasters.