Expressway traffic conditions during the year-end and New Year period (preliminary report) [NEXCO EAST Version]
December 28, 2017 (Thursday) to January 4, 2018 (Thursday) 8 days
- Corporate Top
- Press Room
- Press Release Headquarters
- Expressway traffic conditions during the year-end and New Year period (preliminary report) [NEXCO EAST Version]
January 5, 2018
East Nippon Expressway Co., Ltd.
NEXCO EAST (Chiyoda-ku, Tokyo) has summarized traffic conditions during the year-end and New Year holidays.
- The number of traffic jams over 10 km 45 times, 9 times more than last year Did.
- The number of times of congestion over 30 km, 3 times, 1 increase from last year Did.
- The maximum congestion length is January 2 (Tue) 16:00, E17 35.9km that occurred near the Kosaka Kan-Etsu Expressway (In-bound) Kosaka service area was.
- Compared to last year, the average daily traffic volume of the main 30 sections is also affected by snowfall About 2% decrease Did.
・ C4 Ken-O Road (Okegawa Kano-Shiraoka Iris, Ami East-Inashiki) was opened in February of last year due to the opening of Sakai Furukawa-Tsukuba Central. About 20% increase from last year Did.
・ Compared to last year E4 Tohoku Expressway (Nasu-Shirakawa) decreased by about 5%, E6 Joban Expressway (Takahagi to Kitaibaraki) increased by about 2%.
1 congestion
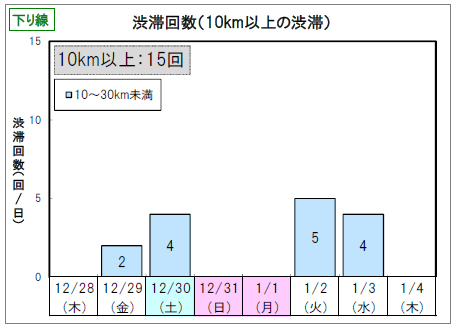
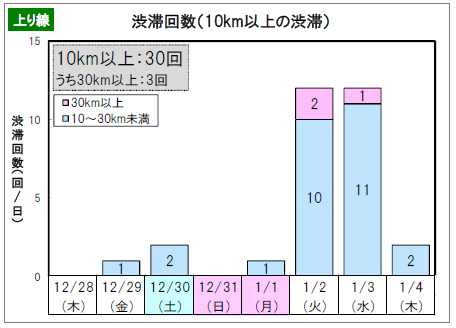
[Number of traffic jams]
[2016: H28.12.28 (Wed) -H29.1.4 (Wed)]
| Traffic jam scale | (1)FY2017 results | (2) FY2016 results | (3) Difference ((1)-(2)) | ||||||
|---|---|---|---|---|---|---|---|---|---|
| total | going down | going up | total | going down | going up | total | going down | going up | |
| Number of traffic jams over 10 km | 45 | 15 | 30 | 36 | 14 | 22 | +9 | +1 | +8 |
| Of which, the number of traffic congestions of 30 km or more | 3 | 0 | 3 | 2 | 0 | 2 | +1 | ±0 | +1 |
2-day average traffic volume
[Average daily traffic during the period]
[2016: H28.12.28 (Wed) -H29.1.4 (Wed)]
| (1)FY2017 results | (2) FY2016 results | YoY (1) / (2) | |
|---|---|---|---|
| Average daily traffic volume | 29,300 Stand / day | 30,000 Stand / day | 97.7% |
- Detailed daily average traffic volume Attachment 1 [PDF: 169KB] please look at.
3 Main traffic congestion points
[Major traffic jam locations during the year-end and New Year period of 2017]
| Vertical line | Road name | Traffic jam date and time (peak) | Traffic jam location | Congestion length | Congestion factors | |
|---|---|---|---|---|---|---|
| 1 | Out-bound line | E17Kan-Etsu Expressway | Wednesday, January 3, around 7:35 | Near Numata IC | 22.8km | Chain regulation |
| 2 | Out-bound line | E14 Keiyo Road | January 2 (Tue) 11:25 | Near Kaizuka IC | 22.7km | Traffic concentration |
| 3 | Out-bound line | E17Kan-Etsu Expressway | Saturday, December 30, around 6:55 | Near Takasaka SA | 18.9km | Traffic concentration and accident |
| 1 | In-bound line | E17Kan-Etsu Expressway | January 2 (Tue) 16:00 | Near Takasaka SA | 35.9km | Accident and traffic concentration |
| 2 | In-bound line | E4 Tohoku Expressway | January 2 (Tue) 18:25 | Near Kuki IC | 33.5km | Traffic concentration and accident |
| 3 | In-bound line | E17Kan-Etsu Expressway | January 3 (Wednesday) around 18:00 | Near Akagi IC | 31.9km | Snowfall and traffic concentration |
[Reference] Major traffic jam locations during the year-end and New Year period of last year (2015)
| Vertical line | Road name | Traffic jam date and time (peak) | Traffic jam location | Congestion length | Congestion factors | |
|---|---|---|---|---|---|---|
| 1 | Out-bound line | E17Kan-Etsu Expressway | December 30 (Friday) around 7:00 | Near Takasaka SA | 20.6km | Traffic concentration and accident |
| 2 | Out-bound line | E14 Keiyo Road | January 2 (Monday) around 11:55 | Near Kaizuka IC | 20.4km | Traffic concentration and accident |
| 3 | Out-bound line | E17Kan-Etsu Expressway | December 29 (Thursday) 7:20 | Near Higashimatsuyama IC | 19.6km | Accident and traffic concentration |
| 1 | In-bound line | E4 Tohoku Expressway | January 2 (Monday) around 17:10 | Near Kazo IC | 36.7km | Accident and traffic concentration |
| 2 | In-bound line | E6 Joban Expressway | January 2 (Monday) around 17:55 | Misato (Misato) Near JCT | 30.3km | Traffic concentration and accident |
| 3 | In-bound line | E4 Tohoku Expressway | January 3 (Tue) 16:35 | Near Hanyu IC | 25.6km | Traffic concentration and accident |
- IC: Interchange, JCT: Junction, SA: Service area
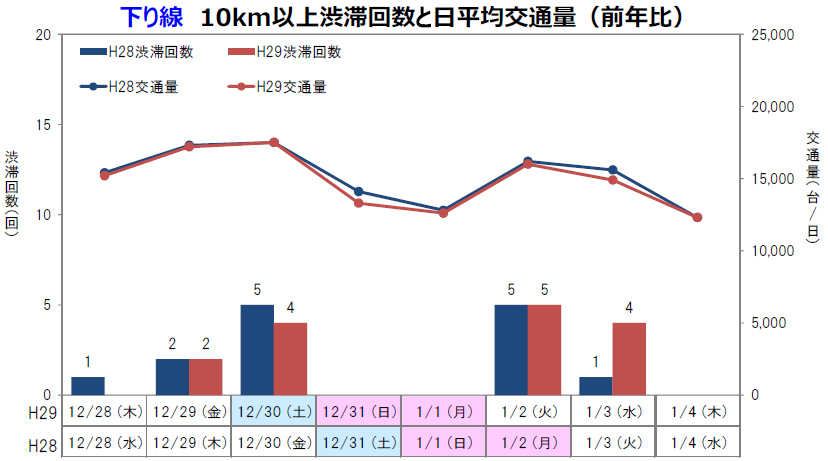
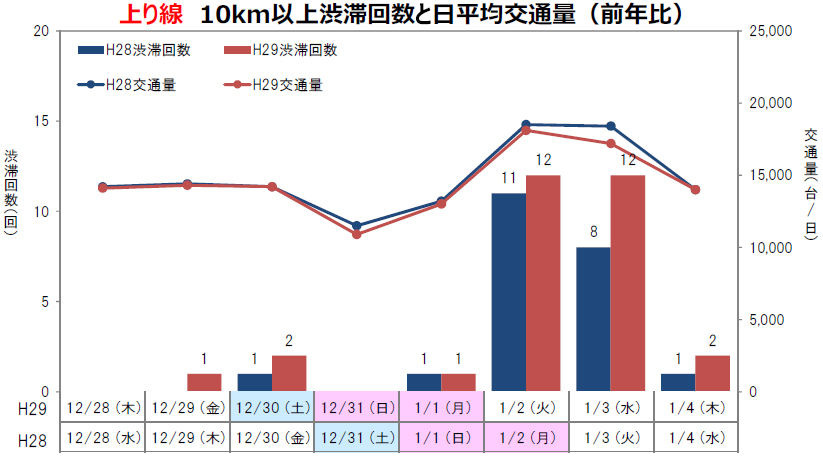
4 Traffic Trends (Year-on-year comparison)
- Peak of congestion is Out-bound line is January 2 (Tuesday), In-bound was the line is January 2 (Tuesday) and January 3 (water).
- The number of traffic jams has increased 9 times from last year.

To view the PDF file, you need the Adobe Systems plug-in software "Acrobat Reader (Japanese version)". If you do not have Download from here (free)Please use it.
Related Sites and Content
If you are looking for information on fares, routes, service areas and parking areas, please click here.
If you are looking for real-time traffic congestion and restriction information, click here.
NEXCO EAST (Road Disaster Prevention Information) Official X
Click here if you are looking for road information such as road closures during disasters.