Expressway traffic during Golden Week (Niigata Prefecture) (preliminary report)
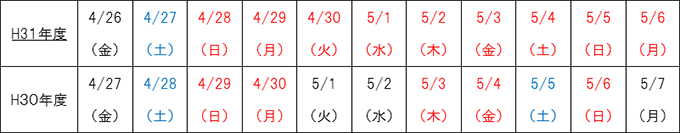
April 26 (Fri), 2019 - May 6 (Mon), 2019, 11 days
(FYZ comparison period April 27, 2018 (Friday)-May 7, 2018 (Monday) 11 days)
- Corporate Top
- Press Room
- Press Release Niigata office
- Expressway traffic during Golden Week (Niigata Prefecture) (preliminary report)
May 7, 2019
East Nippon Expressway Co., Ltd.
Niigata office
NEXCO EAST Niigata branch (Niigata city Chuo Ward) organized the traffic situation during the Golden Week period.
Traffic overview
- The average daily traffic volume of the main sections is year-on-year 15% increase Did.
- The peak traffic volume during the period is Both upper and lower lines are Friday, May 3 have become.
- The number of traffic jams over 5km 3 times, 1 decrease from the previous year Did.
- The biggest traffic jam that occurred during the period was E8 Hokuriku Expressway (Out-bound line) Makigata East IC-Niigata West IC "12.0km" caused by the accident that occurred on Sunday, April 28 was.
1 Major sections during Golden Week * 1 Average daily traffic * 2 (Unit / day)
| Road name | section | Heisei 31 (R1) year A |
Heisei 30 years B |
Year-on-year A / B |
|---|---|---|---|---|
| E8Hokuriku Expressway | Sanjo Tsubame IC-Makigata East IC | 56,500 | 52,700 | 107% |
| Joetsu IC-Kakizaki IC | 31,700 | 26,300 | 121% | |
| Familiar IC-Itoigawa IC | 26,400 | 25,100 | 105% | |
| E17Kan-Etsu Expressway | Ojiya IC-Nagaoka IC | 30,000 | 26,500 | 113% |
| Minakami IC to Yuzawa IC | 34,300 | 29,900 | 115% | |
| E49 Ban-Etsu Expressway | Niitsu Nishi Smart IC-Niigata Central JCT | 15,200 | 13,000 | 117% |
| Tsugawa IC-Mikawa IC | 15,900 | 13,100 | 121% | |
| E18 Joshin-Etsu Expressway | Joetsutakada IC-Joetsu JCT | 25,000 | 19,500 | 128% |
| Shinano-machi IC - Myoko Kougen IC | 27,800 | 22,100 | 126% | |
| E7 Tohoku Expressway | Nakajo IC-Arakawa Wombai IC | 15,600 | 13,200 | 118% |
| Daily traffic volume based on simple average of the above 10 sections | 27,800 | 24,100 | 115% | |
"IC: Interchange", "JCT: Junction"
- : Interchange section near prefectural borders and major cities
- : Traffic volume is an approximate value based on the traffic counter (all models)
2 Main traffic congestion points
Year of Heisei 31 (R1) Traffic congestion during the Golden Week period (maximum traffic length of 5 km or more): 3 times in total| worst | Road name / direction | Date and time of traffic jam | Traffic jam location | Congestion length | Congestion factors |
|---|---|---|---|---|---|
| 1 | E8Hokuriku Expressway (below) | Sunday, April 28 15:11 | Makigata East-Niigata West | 12.0 km | accident |
| 2 | E8 Hokuriku Expressway (above) | Saturday, May 4 10:22 | Makigata East-Sanjo Tsubame | 11.9km | accident |
| 3 | E8Hokuriku Expressway (below) | Saturday, May 4 11:09 | Tsubame Sanjo-Makigata East | 9.5km | accident |
2018 Traffic congestion during the Golden Week period (maximum traffic length of 5 km or more): 4 times in total
| worst | Road name / upper / lower line | Date and time of traffic jam | Traffic jam location | Congestion length | Congestion factors |
|---|---|---|---|---|---|
| 1 | E8Hokuriku Expressway (below) | Thursday, May 3 9:50 | Nakanoshima Mitsuke-Nishiyama | 13.2km | Traffic concentration |
| 2 | E18 Joshin-Etsu Expressway (below) | Saturday, May 5 16:38 | Joetsutakada-Nakago | 12.2km | Traffic concentration |
| 3 | E18 Joshin-Etsu Expressway (above) | Saturday, May 5 9:35 | Nakago-Joetsutakada | 8.0km | Traffic concentration |
| 4 | E8Hokuriku Expressway (below) | Thursday, May 3 12:33 | Sanjo Tsubame-Nakanoshima Mitsuke | 5.9km | Traffic concentration |
3 Reference materials (attached sheet)

To view the PDF file, you need the Adobe Systems plug-in software "Acrobat Reader (Japanese version)". If you do not have Download from here (free)Please use it.
Related Sites and Content
If you are looking for information on fares, routes, service areas and parking areas, please click here.
If you are looking for real-time traffic congestion and restriction information, click here.
NEXCO EAST (Road Disaster Prevention Information) Official X
Click here if you are looking for road information such as road closures during disasters.