ゴールデンウィーク期間における高速道路の交通状況(速報)【東日本版】
平成29年4月28日(金)~平成29年5月7日(日)10日間
平成29年5月8日
東日本高速道路株式会社
NEXCO東日本(東京都千代田区)は、ゴールデンウィーク期間における交通状況をとりまとめました。
【交通状況の概要】
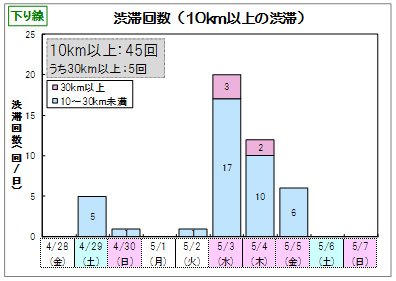
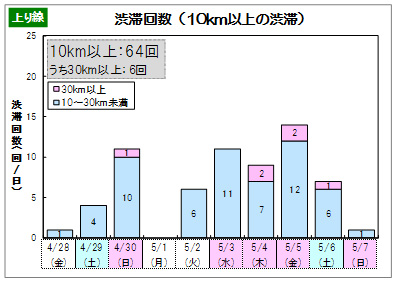
- 10km以上の渋滞回数は、109回と昨年と比較して20回増加しました。
- 30km以上の渋滞回数は、11回と昨年と比較して2回増加しました。
- 最大の渋滞長は、5月3日(水)8時55分頃、関越道(下り線)花園IC付近を先頭に発生した49.0kmでした。
- 主な30区間の日平均交通量の対前年比は、約7%増加しました。
1.混雑状況
【渋滞回数】
[平成28年度:H28.4.29(金)~H28.5.8(日)]
| 渋滞規模 | (1)平成29年度実績 | (2)平成28年度実績 | (3)差((1)-(2)) | ||||||
|---|---|---|---|---|---|---|---|---|---|
| 合計 | 下り | 上り | 合計 | 下り | 上り | 合計 | 下り | 上り | |
| 10㎞以上の渋滞回数 | 109 | 45 | 64 | 89 | 35 | 54 | +20 | +10 | +10 |
| うち、30㎞以上の渋滞回数 | 11 | 5 | 6 | 9 | 3 | 6 | +2 | +2 | ±0 |
2.日平均交通量
【主な23区間※における期間中の日平均交通量】
[平成28年度:H28.4.29(金)~H28.5.8(日)]
| (1)平成29年度実績 | (2)平成28年度実績 | 対前年比(1)/(2) | |
|---|---|---|---|
| 日平均交通量 | 39,400台/日 | 36,800台/日 | 107% |
- 詳細な日平均交通量は別紙1【PDF:149KB】をご覧ください。
【参考】過去の曜日配列

3.主な渋滞箇所
【平成29年度 ゴールデンウィーク期間の主な渋滞発生箇所】
| 上下線 | 道路名 | 渋滞日時(ピーク) | 渋滞発生箇所 | 渋滞長 | 渋滞要因 | |
|---|---|---|---|---|---|---|
| 1 | 下り線 | E17関越道 | 5月3日(水)8:55頃 | 花園(ハナゾノ)IC付近 | 49.0km | 交通集中及び事故 |
| 2 | 下り線 | E4東北道 | 5月3日(水)10:50頃 | 栃木(トチギ)IC付近 | 43.6km | 交通集中及び事故 |
| 3 | 下り線 | E6常磐道 | 5月3日(水)9:35頃 | 桜土浦(サクラツチウラ)IC付近 | 40.7km | 交通集中及び事故 |
| 1 | 上り線 | E4東北道 | 5月5日(金)15:50頃 | 久喜(クキ)IC付近 | 42.0km | 交通集中及び事故 |
| 2 | 上り線 | E17関越道 | 5月4日(木)18:50頃 | 高坂(タカサカ)SA付近 | 39.6km | 交通集中及び事故 |
| 2 | 上り線 | E17関越道 | 5月5日(金)18:55頃 | 高坂(タカサカ)SA付近 | 39.6km | 事故及び交通集中 |
| 3 | 上り線 | E4東北道 | 5月6日(土)15:50頃 | 上河内(カミカワチ)SA付近 | 37.8km | 交通集中及び事故 |
【参考】昨年度(平成28年度)のゴールデンウィーク期間の主な渋滞発生箇所
| 上下線 | 道路名 | 渋滞日時(ピーク) | 渋滞発生箇所 | 渋滞長 | 渋滞要因 | |
|---|---|---|---|---|---|---|
| 1 | 下り線 | E17関越道 | 5月3日(火)11:00頃 | 藤岡(フジオカ)JCT付近 | 70.2km | 交通集中及び事故 |
| 2 | 下り線 | E6常磐道 | 5月3日(火)10:45頃 | 友部(トモベ)JCT付近 | 52.5km | 交通集中及び事故 |
| 3 | 下り線 | E4東北道 | 5月3日(火)6:50頃 | 羽生(ハニュウ)PA付近 | 42.8km | 交通集中及び事故 |
| 1 | 上り線 | E4東北道 | 5月5日(木)12:55頃 | 上河内(カミカワチ)SA付近 | 46.5km | 事故及び交通集中 |
| 2 | 上り線 | E4東北道 | 5月1日(日)18:20頃 | 加須(カゾ)IC付近 | 46.3km | 交通集中及び事故 |
| 3 | 上り線 | E17関越道 | 5月1日(日)16:40頃 | 高坂(タカサカ)SA付近 | 44.0km | 交通集中及び事故 |
| 3 | 上り線 | E17関越道 | 5月5日(木)17:45頃 | 高坂(タカサカ)SA付近 | 44.0km | 交通集中及び事故 |
- IC:インターチェンジ、JCT:ジャンクション、SA:サービスエリア、PA:パーキングエリア
【参考】全国の渋滞回数(NEXCO東日本・中日本・西日本、本四高速)
[平成28年度:H28.4.29(金)~H28.5.8(日)]
| 渋滞規模 | (1)平成29年度実績 | (2)平成28年度実績 | (3)差((1)-(2)) | ||||||
|---|---|---|---|---|---|---|---|---|---|
| 合計 | 下り | 上り | 合計 | 下り | 上り | 合計 | 下り | 上り | |
| 10㎞以上の渋滞回数 | 355 | 159 | 196 | 270 | 104 | 166 | +85 | +55 | +30 |
| うち、30㎞以上の渋滞回数 | 26 | 15 | 11 | 20 | 8 | 12 | +6 | +7 | ▲1 |

PDFファイルをご覧いただくには、AdobeSystems社のプラグインソフト「Acrobat Reader(日本語版)」が必要です。お持ちでない方は、こちらからダウンロード(無料)してご利用ください。
関連サイト・コンテンツ
料金・ルート検索、サービスエリア・パーキングエリアの情報をお探しの方はこちら。
リアルタイムの渋滞・規制情報をお探しの方はこちら。
災害時の通行止めなどの道路情報をお探しの方はこちら。